How to upgrade? Simply download rubiTrack 6 and launch it.
You can upgrade all your data from the rubiTrack version you are using. For details, please see the Upgrade Step-by-Step Guide.
rubiTrack 6 comes with many new features and improvements, below are the most important ones.
rubiTrack 6 is a Universal App available from the App Store for both Mac and iPhone.
What's New?
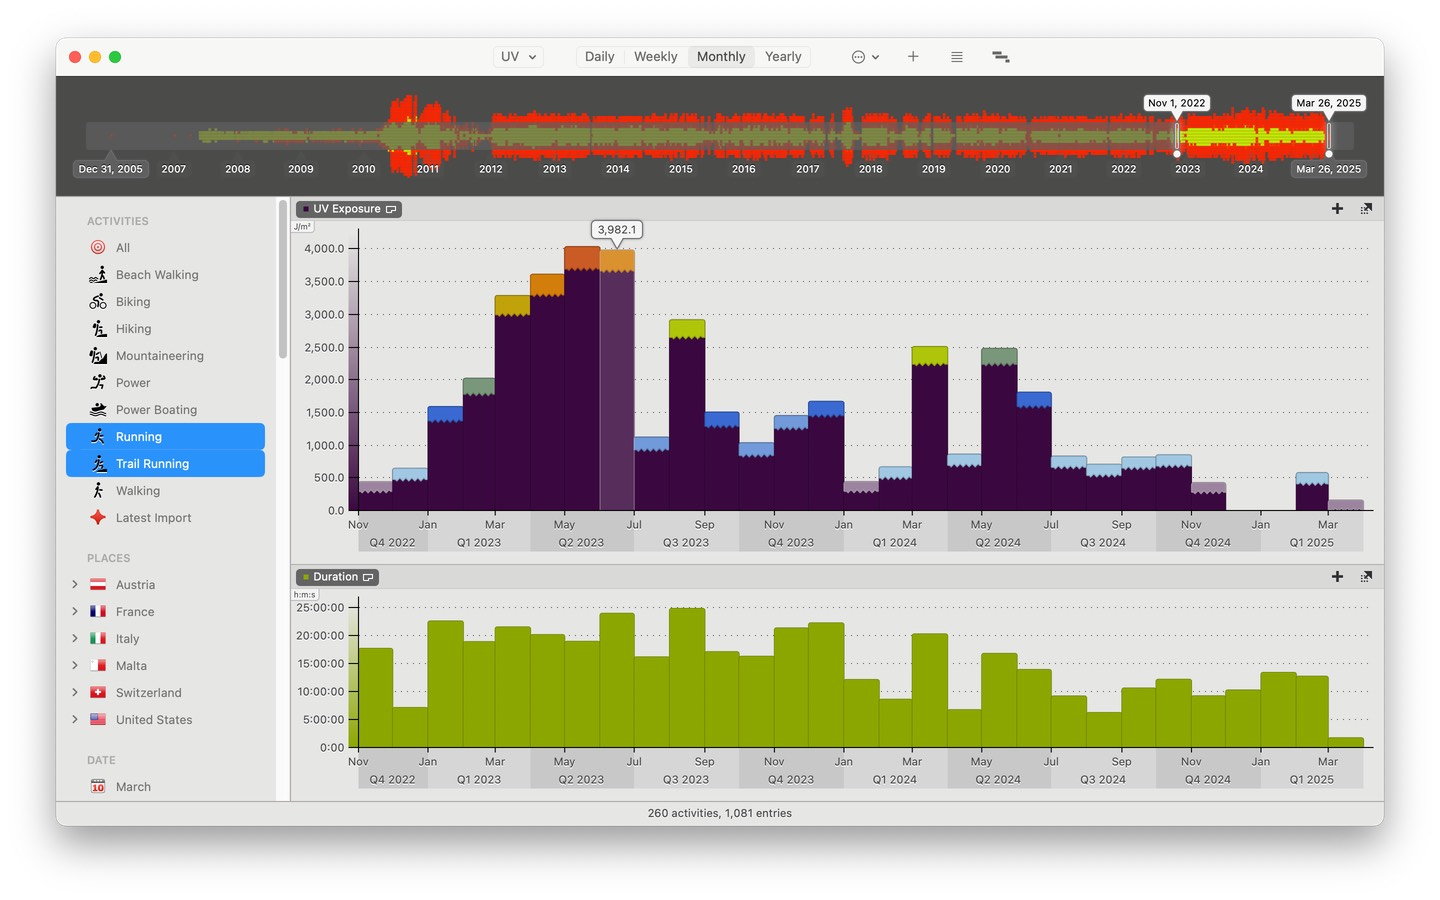
Keep an eye on your UV exposure and stay healthy (new in 6.3)
Using the new chart curve for UV exposure in the Training Summary, you can track the accumulated UV exposure during activities. This allows you to quantify your relative UV exposure taking into account both UV index and duration.
rubiTrack recorded UV index data since late 2022, so there is already a lot of data available to be explored.
Support for Garmin MTP-connected devices (new in 6.2.2)
Your Garmin device may not show up as a volume when connected to your Mac. In that case, it uses a connection type known as Media Transfer Protocol.
rubiTrack 6 PRO Version 6.2.2 adds support for MTP devices.
Support for Garmin Connect health data (new in 6.2)
When syncing with Garmin Connect, rubiTrack now imports weight, body composition values as well as blood pressure values and heart rate variability values.
rubiTrack now supports Garmin Running Dynamics and Garmin Cycling Dynamics.
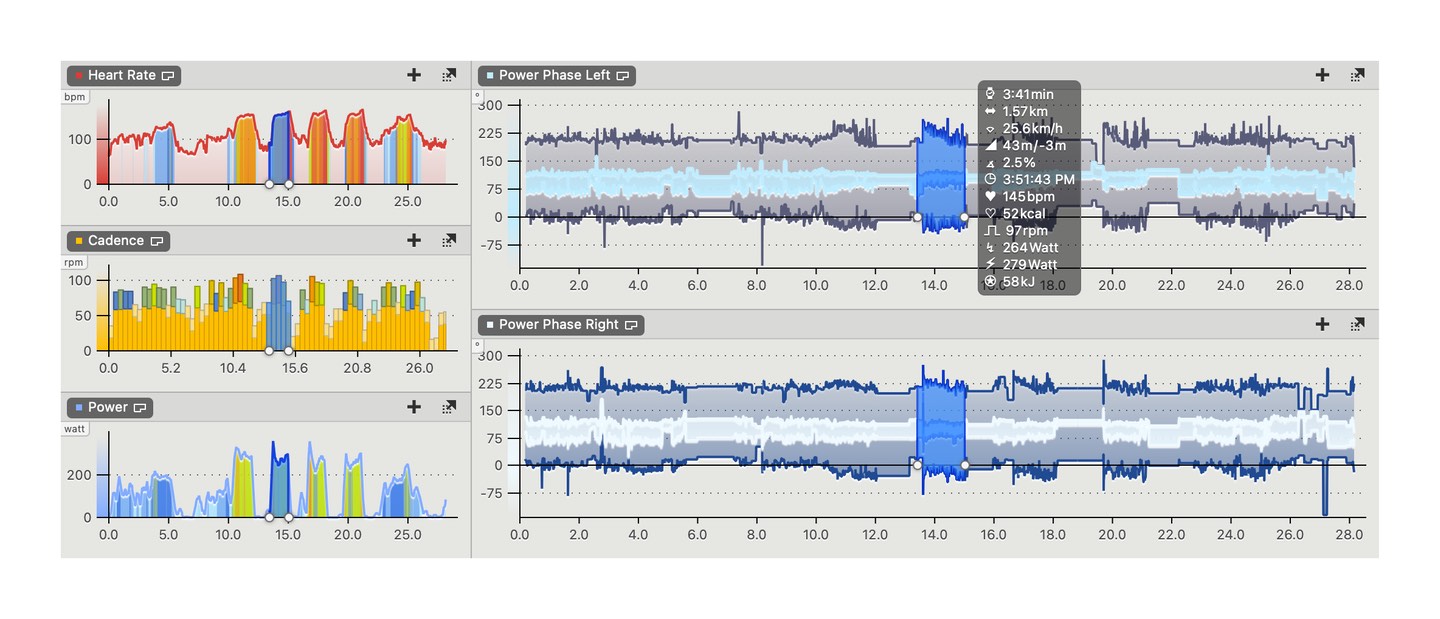
Adds the new metrics Ground Contact Time Balance (Left-Right-Balance in rubiTrack), Stride Length, Vertical Ratio and Respiration Rate as well as Left Power Phase, Right Power Phase, Left Platform Center Offset and Right Platform Center Offset.
The training summary now supports zones (new in 6.2)
Use zones to more easily monitor improvements and visualize goals for certain metrics (total milage or workout duration, weight or resting heart rate).
All activity and athlete log value curves in the Training Summary support zones (except for bone mass and metabolic age).
All zones come pre-defined with useful default value ranges, they are freely user customizable.
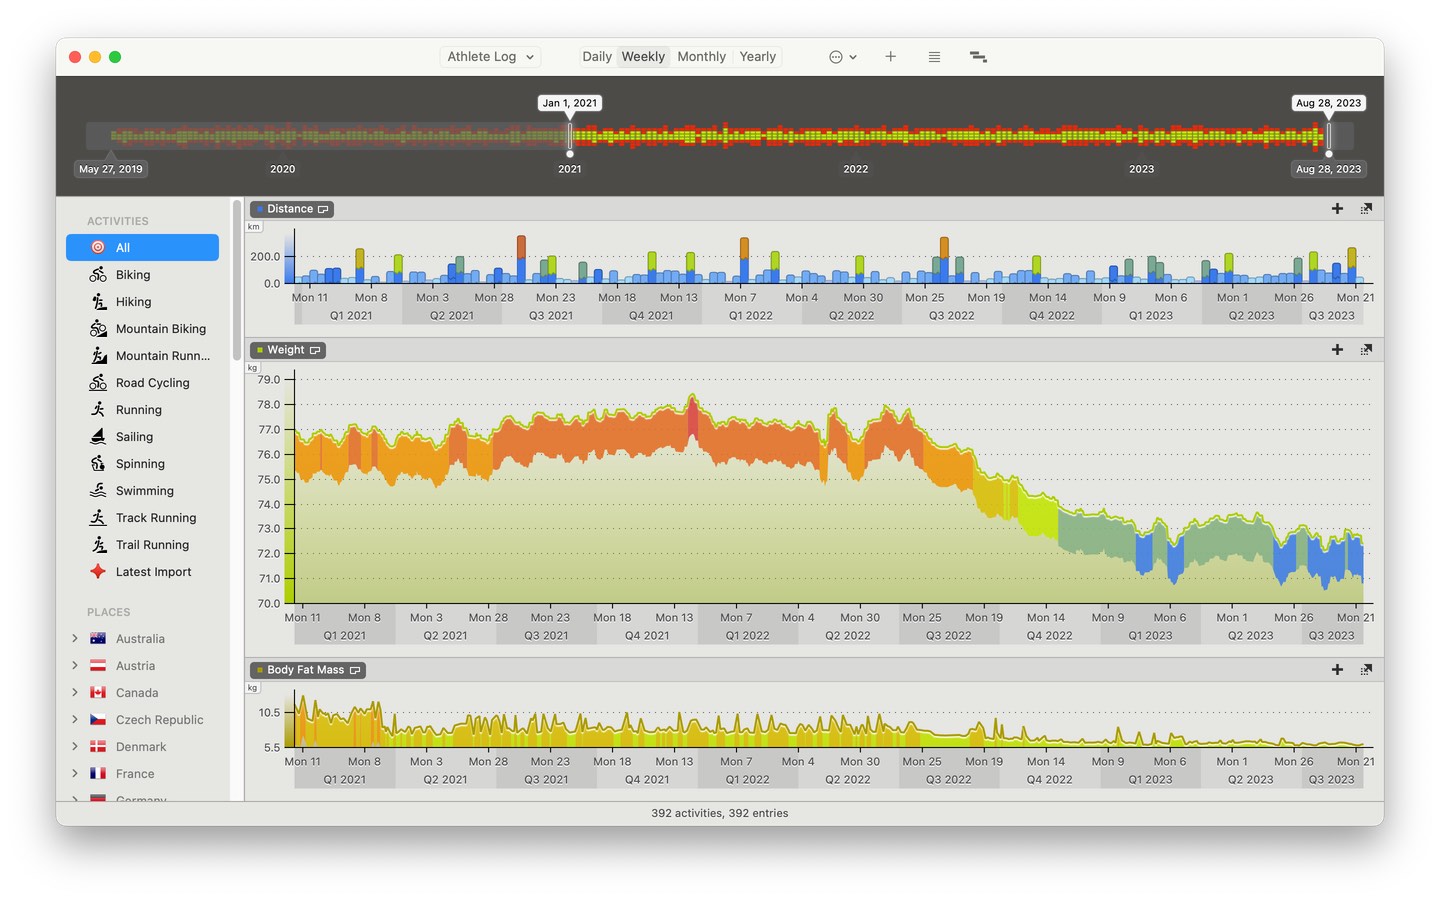
The Training Summary zones setup is transferred to rubiTrack for iPhone from the Mac when WiFi-syncing.
Much more flexible display of zones in charts (new in 6.2)
For each individual curve that supports zones, possible options are Off, Curve, Area, Axis and Background.
Curve corresponds to the classic rubiTrack zone display, were zones are displayed right on the curve or bars.
Area displays zones like the Curve option, but fills the curve's entire area, not just its top portion.
Axis colorizes the Y-axis according to the zones configuration.
Background paints zones across the entire background of the curve, in addition to the axis colorization.
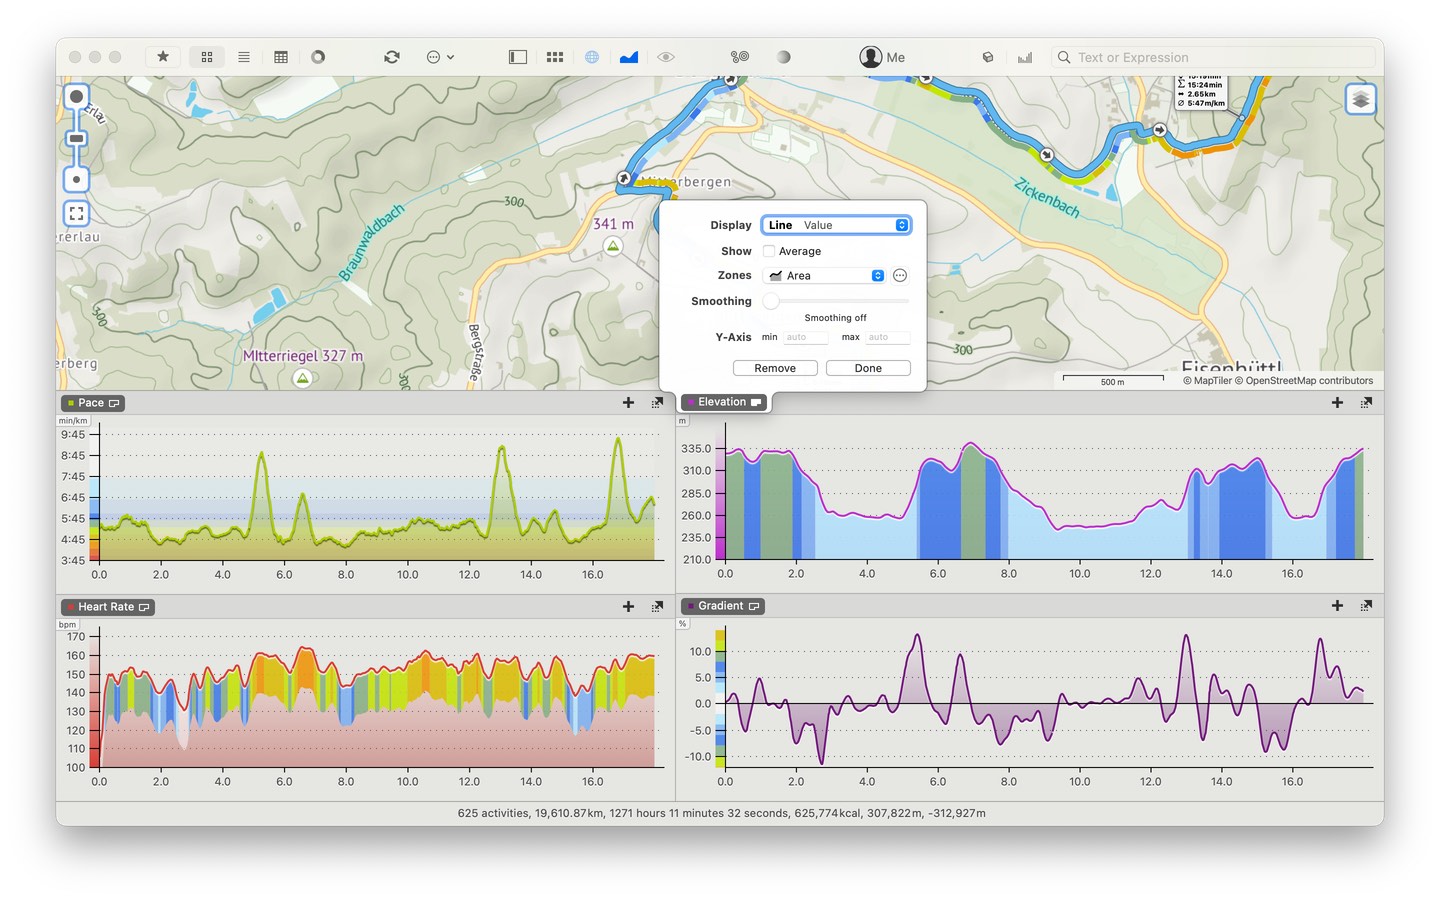
The strength of the colors in the background zones can be adjusted using the new setting Background Zones Opacity in the application preferences (via "rubiTrack > Preferences >> Advanced…" from the main menu).
Adds user interface for zones configuration in the appropriate chart curve configuration dialogs, both for activity zones and zones in the Training Summary.
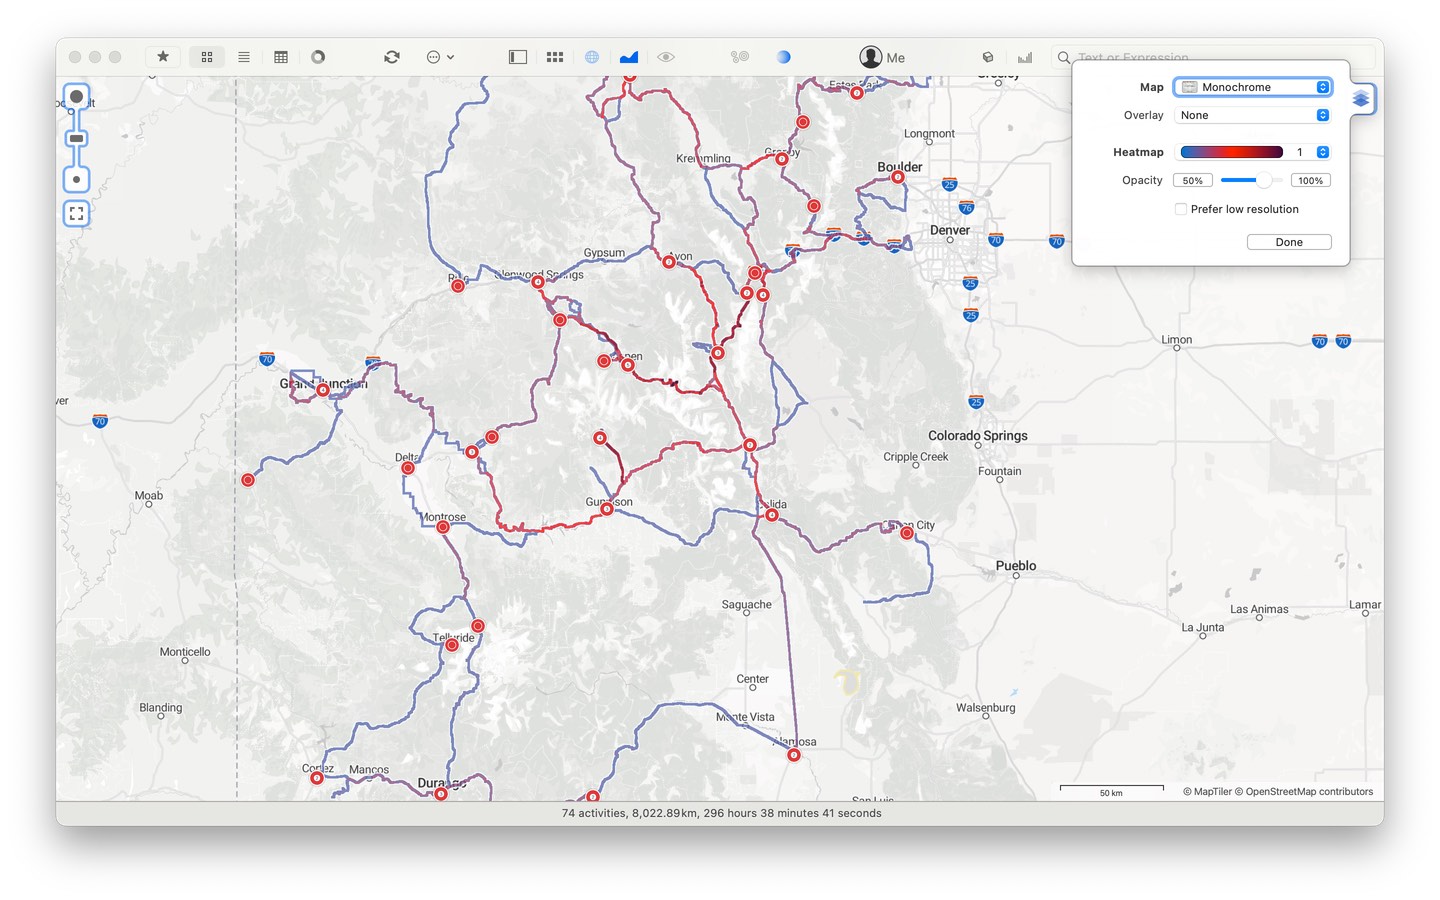
Heatmap (new in 6.1)
rubiTrack instantly displays traces of activity tracks and colorizes them according to frequency of visits to a point on the map.
The heatmap is always generated live based on the current activity collection, so filtering activities through any sidebar filter or the search filter changes the heatmap.
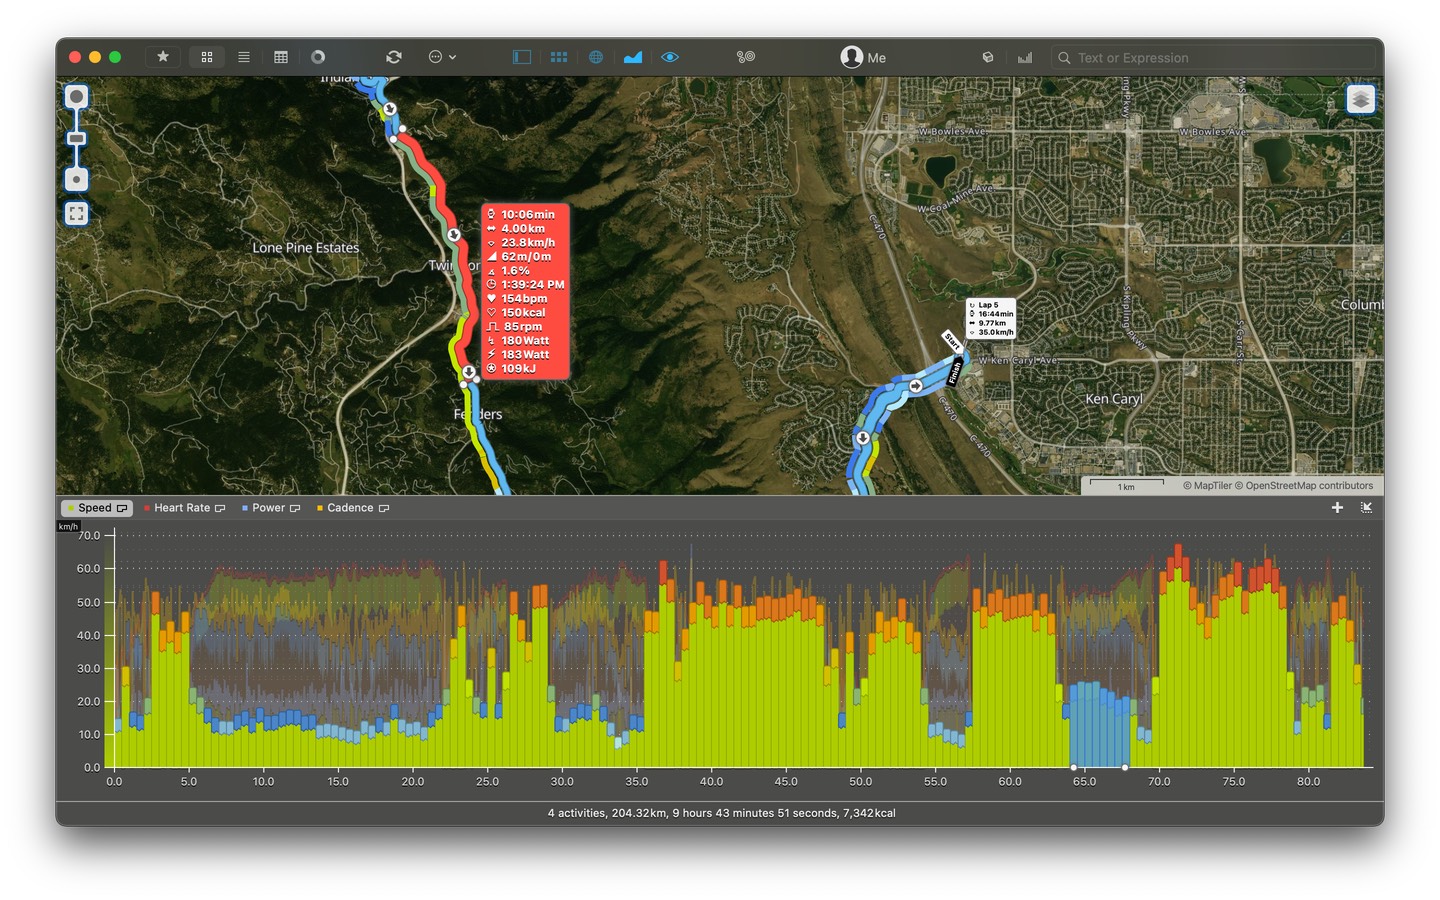
Dark mode
Both the macOS and the iOS version now look stunningly beautiful in dark mode.
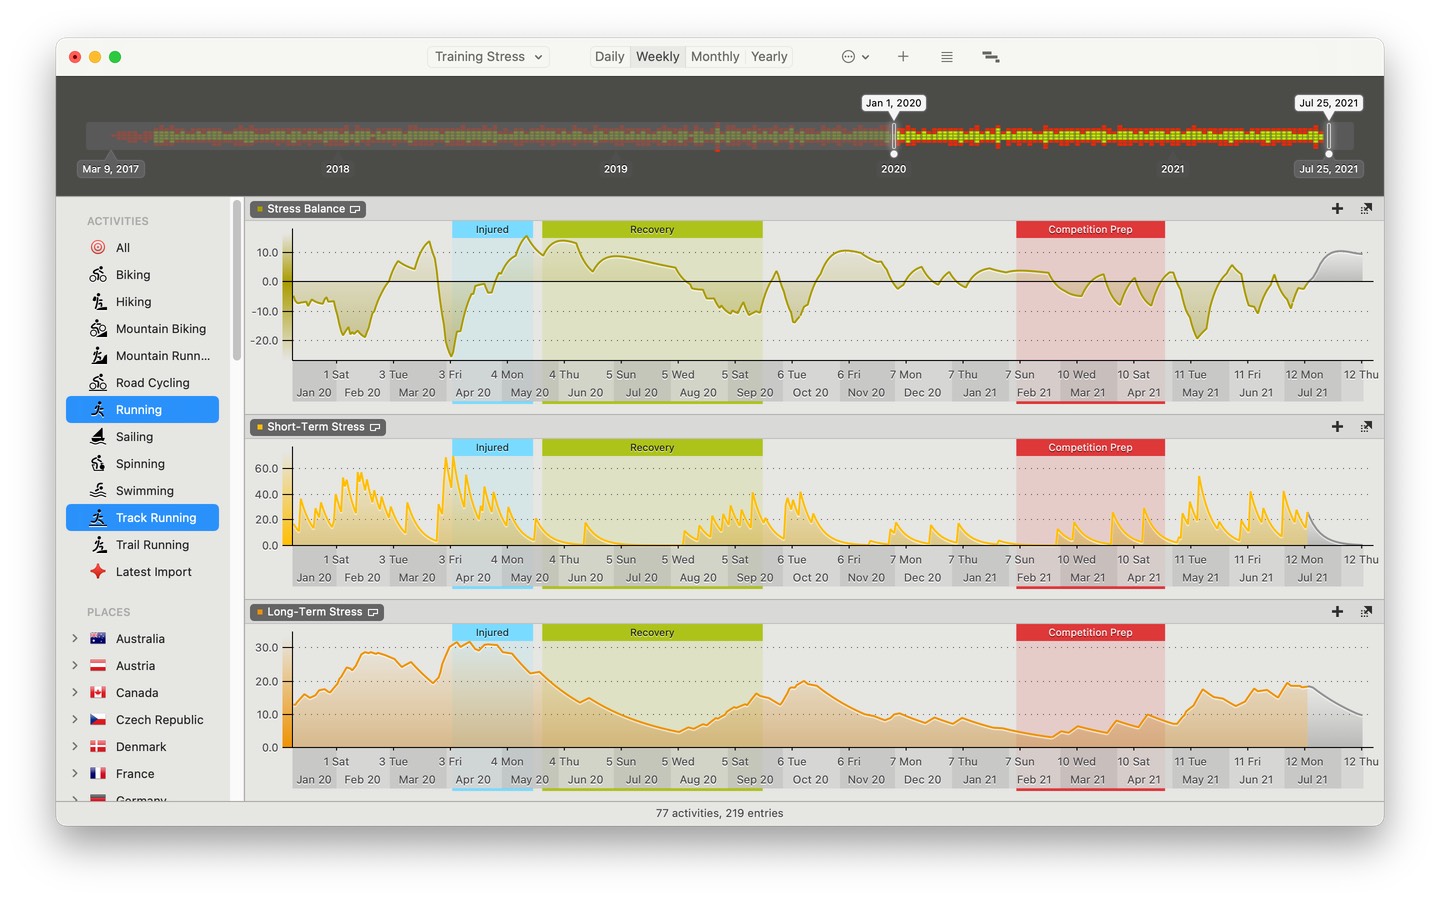
Time Spans
Adds the new Time Spans feature.
- Time spans are used to highlight or mark periods of time in the Training Summary. For example, Time spans can be used to mark different things like a period of preparation for a competition, a vacation, a period of recovery after an injury just to name a few.
- Time spans are displayed in the background of all chart curves in the Training Summary and the equipment charts.
- Manage using the Time Spans Manager accessible via toolbar or from the action menu.
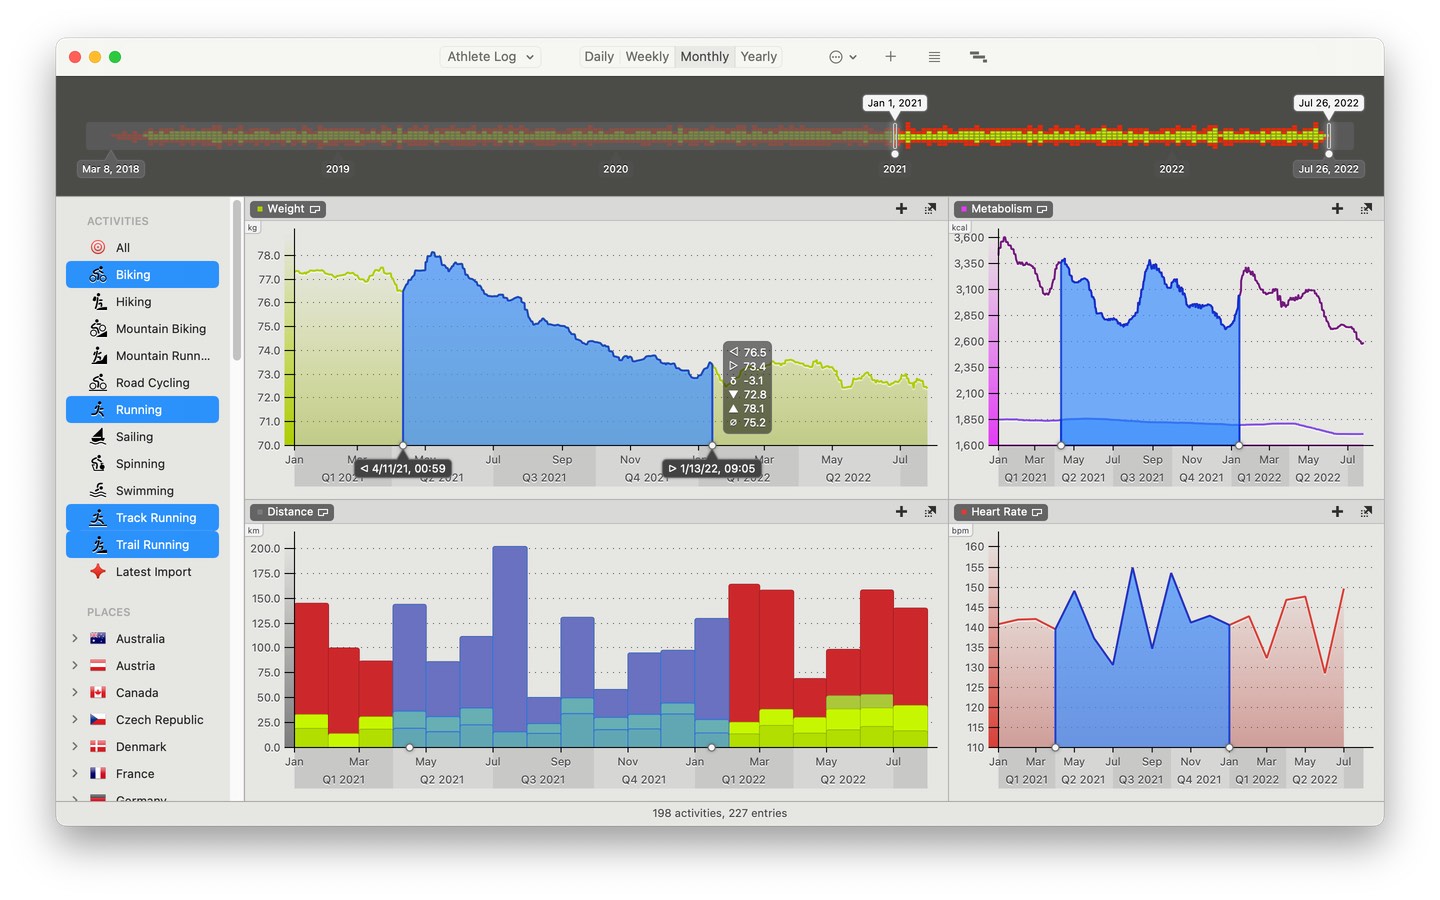
Instant statistics and date markers (new in 6.1)
Instant quick statistics display the start value, end value and difference as well as minimum and maximum value and weighted average of the selected curve portion. All athlete and activity curves produce these statistics.
Whenever a selection is made in the Training Summary, rubiTrack now shows the date of the start and end points of the selection.
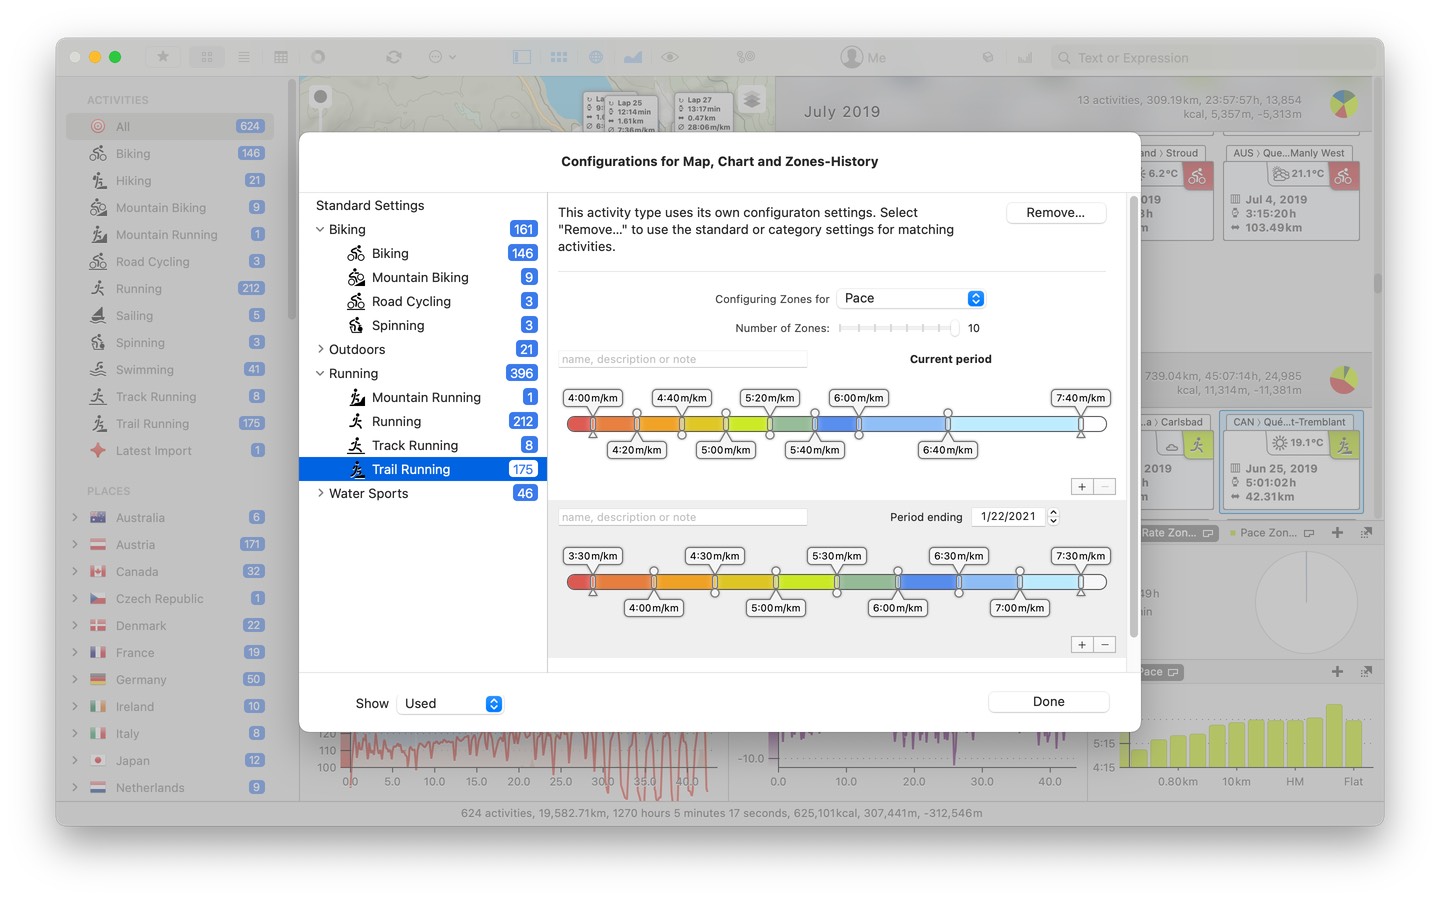
Configurations and dated zones
All new Configurations user interface (via "Customize > Configurations…").
- Configurations are the sum of all settings used in map and chart and most importantly the zones setup.
- Visualizes the configuration tree with standard settings, category and activity type configurations.
- Configurations for categories and activity types can be added and removed through the UI.
Dated zones are set up in the new Configurations UI which replaces the old zones editor.
- Each configuration has one "current" zone setup that is undated and cannot be removed (this is equivalent to the previous zones).
- Additionally, each configuration can have dated zones.
- Dated zones configurations are sorted chronologically in descending order and separated by at least one calendar day.
- There is no limit to the number of dated zones.
- Whenever rubiTrack uses zones, it will use the setup corresponding to the activity's date or the current setup if no matching dated zones exist.
Garmin Connect
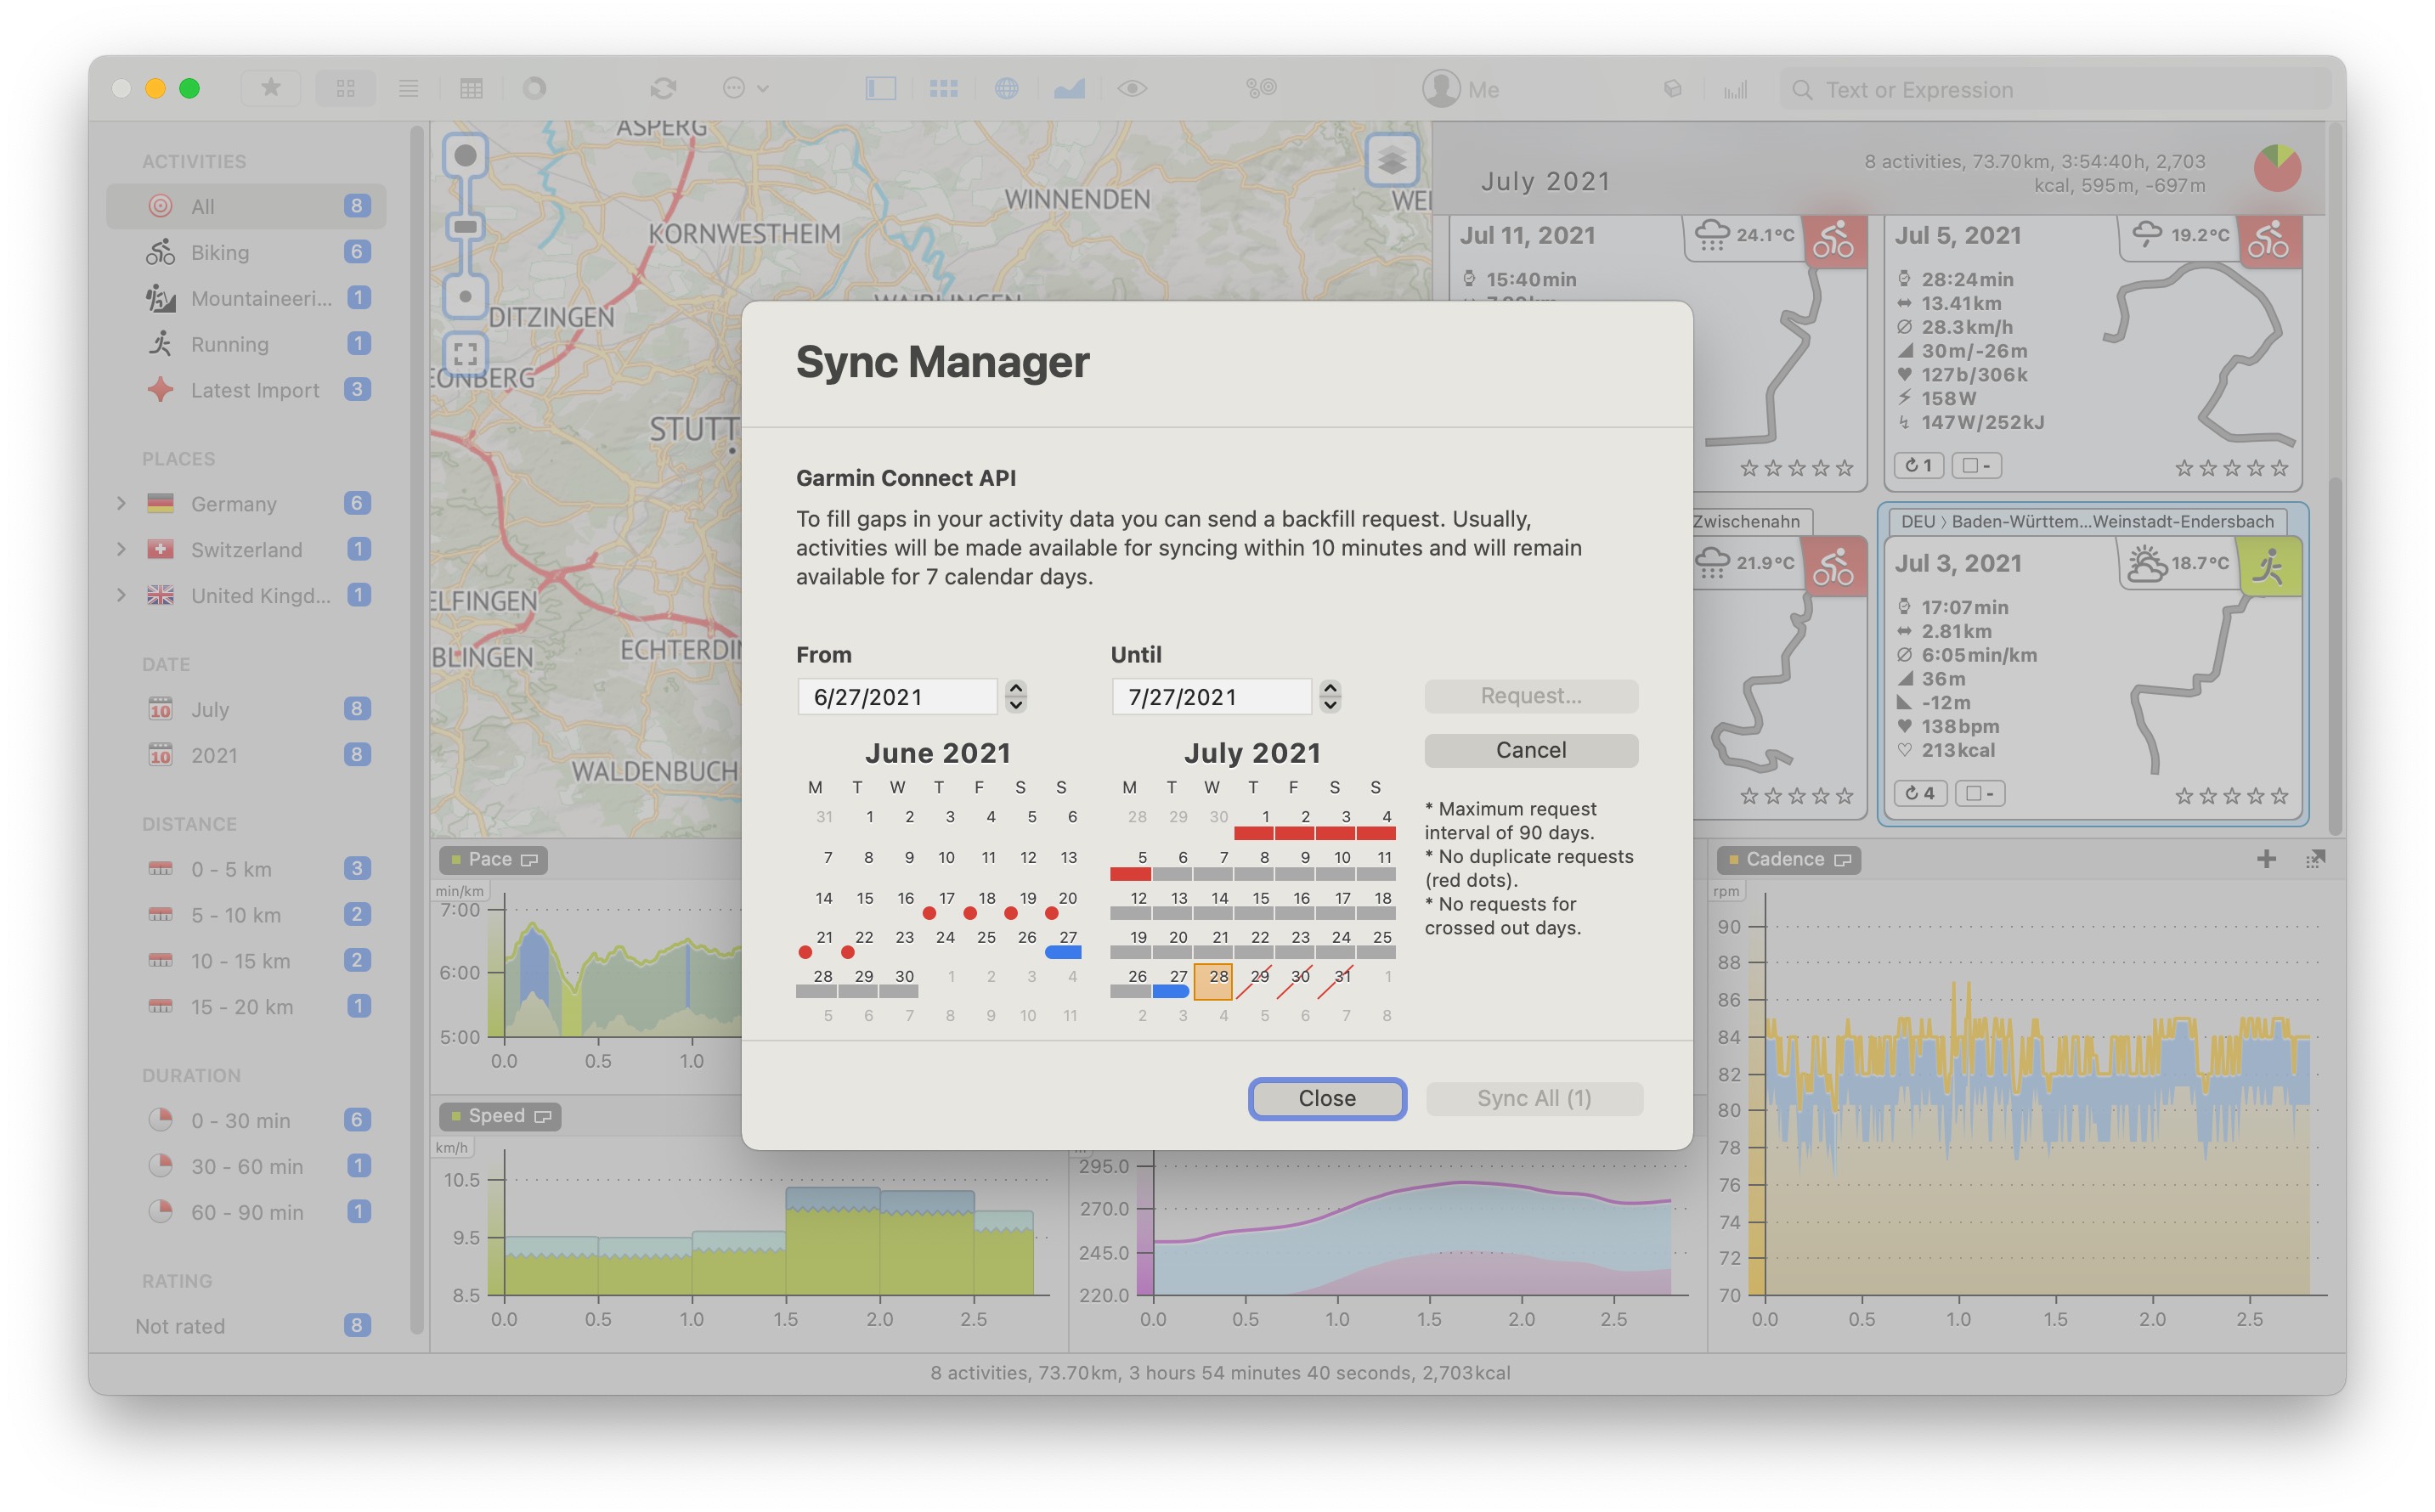
Completely new Garmin Connect connectivity.
- Provides fast and reliable access to new activities uploaded to Garmin Connect.
- Uses official Garmin Connect API.
- Once authorized, new activities in Garmin Connect will become available for syncing for 7 calendar days.
- To fill data gaps, backfills can be requested through the Sync Manager. Garmin Connect will make matching activities available for syncing for 7 calendar days.
Heart rate in length-based swimming activities (new in 6.1)
Supports activities from the Apple Watch, from Garmin Connect or via file import from FIT-files.
If heart rate or other track data data is available, that information can be viewed in the chart alongside length-based curves like SWOLF or Swim Pace.
Support for Stryd sensors (new in 6.1)
Now imports "Power", "Form Power" and "Leg Spring Stiffness" from such activities.
- Adds the "Form Power" and "Leg Spring Stiffness" chart curves for activities.
- Adds the "Form Power" and "Leg Spring Stiffness" activity data fields on the Training tab. These values are populated with the weighted average of the respective curves during import.
- Adds the "Form Power" and "Leg Spring Stiffness" columns in the activity list view and the track data editor.
Activity types
Adds new "Units" column in the activity types manager ("Customize > Activity Types…") which replaces the old "Nautical" column. This setting can be used to alter the default units used to display activity metrics.
(new in 6.2) Adds a new activity type unit option named "running". When this option is used, cadence will be displayed in steps per minute for both feet instead of one foot.
Adds new "Hidden" column in the activity types manager, which allows for hiding activity types that are of no interest to the user.
Adds a new dynamic filter group to the equipment selection popup for filtering by the activity type of the selected activity.
When editing equipment using "Activity > Equipment…", multi-selections are now supported. The selected equipment applies to all selected activities.
Equipment
Maintenance warnings can now be set up to auto-repeat themselves. When a maintenance warning with auto-repeat fires, the warning threshold value automatically increases by the amount set in the repeat value.
Chart, chart colors
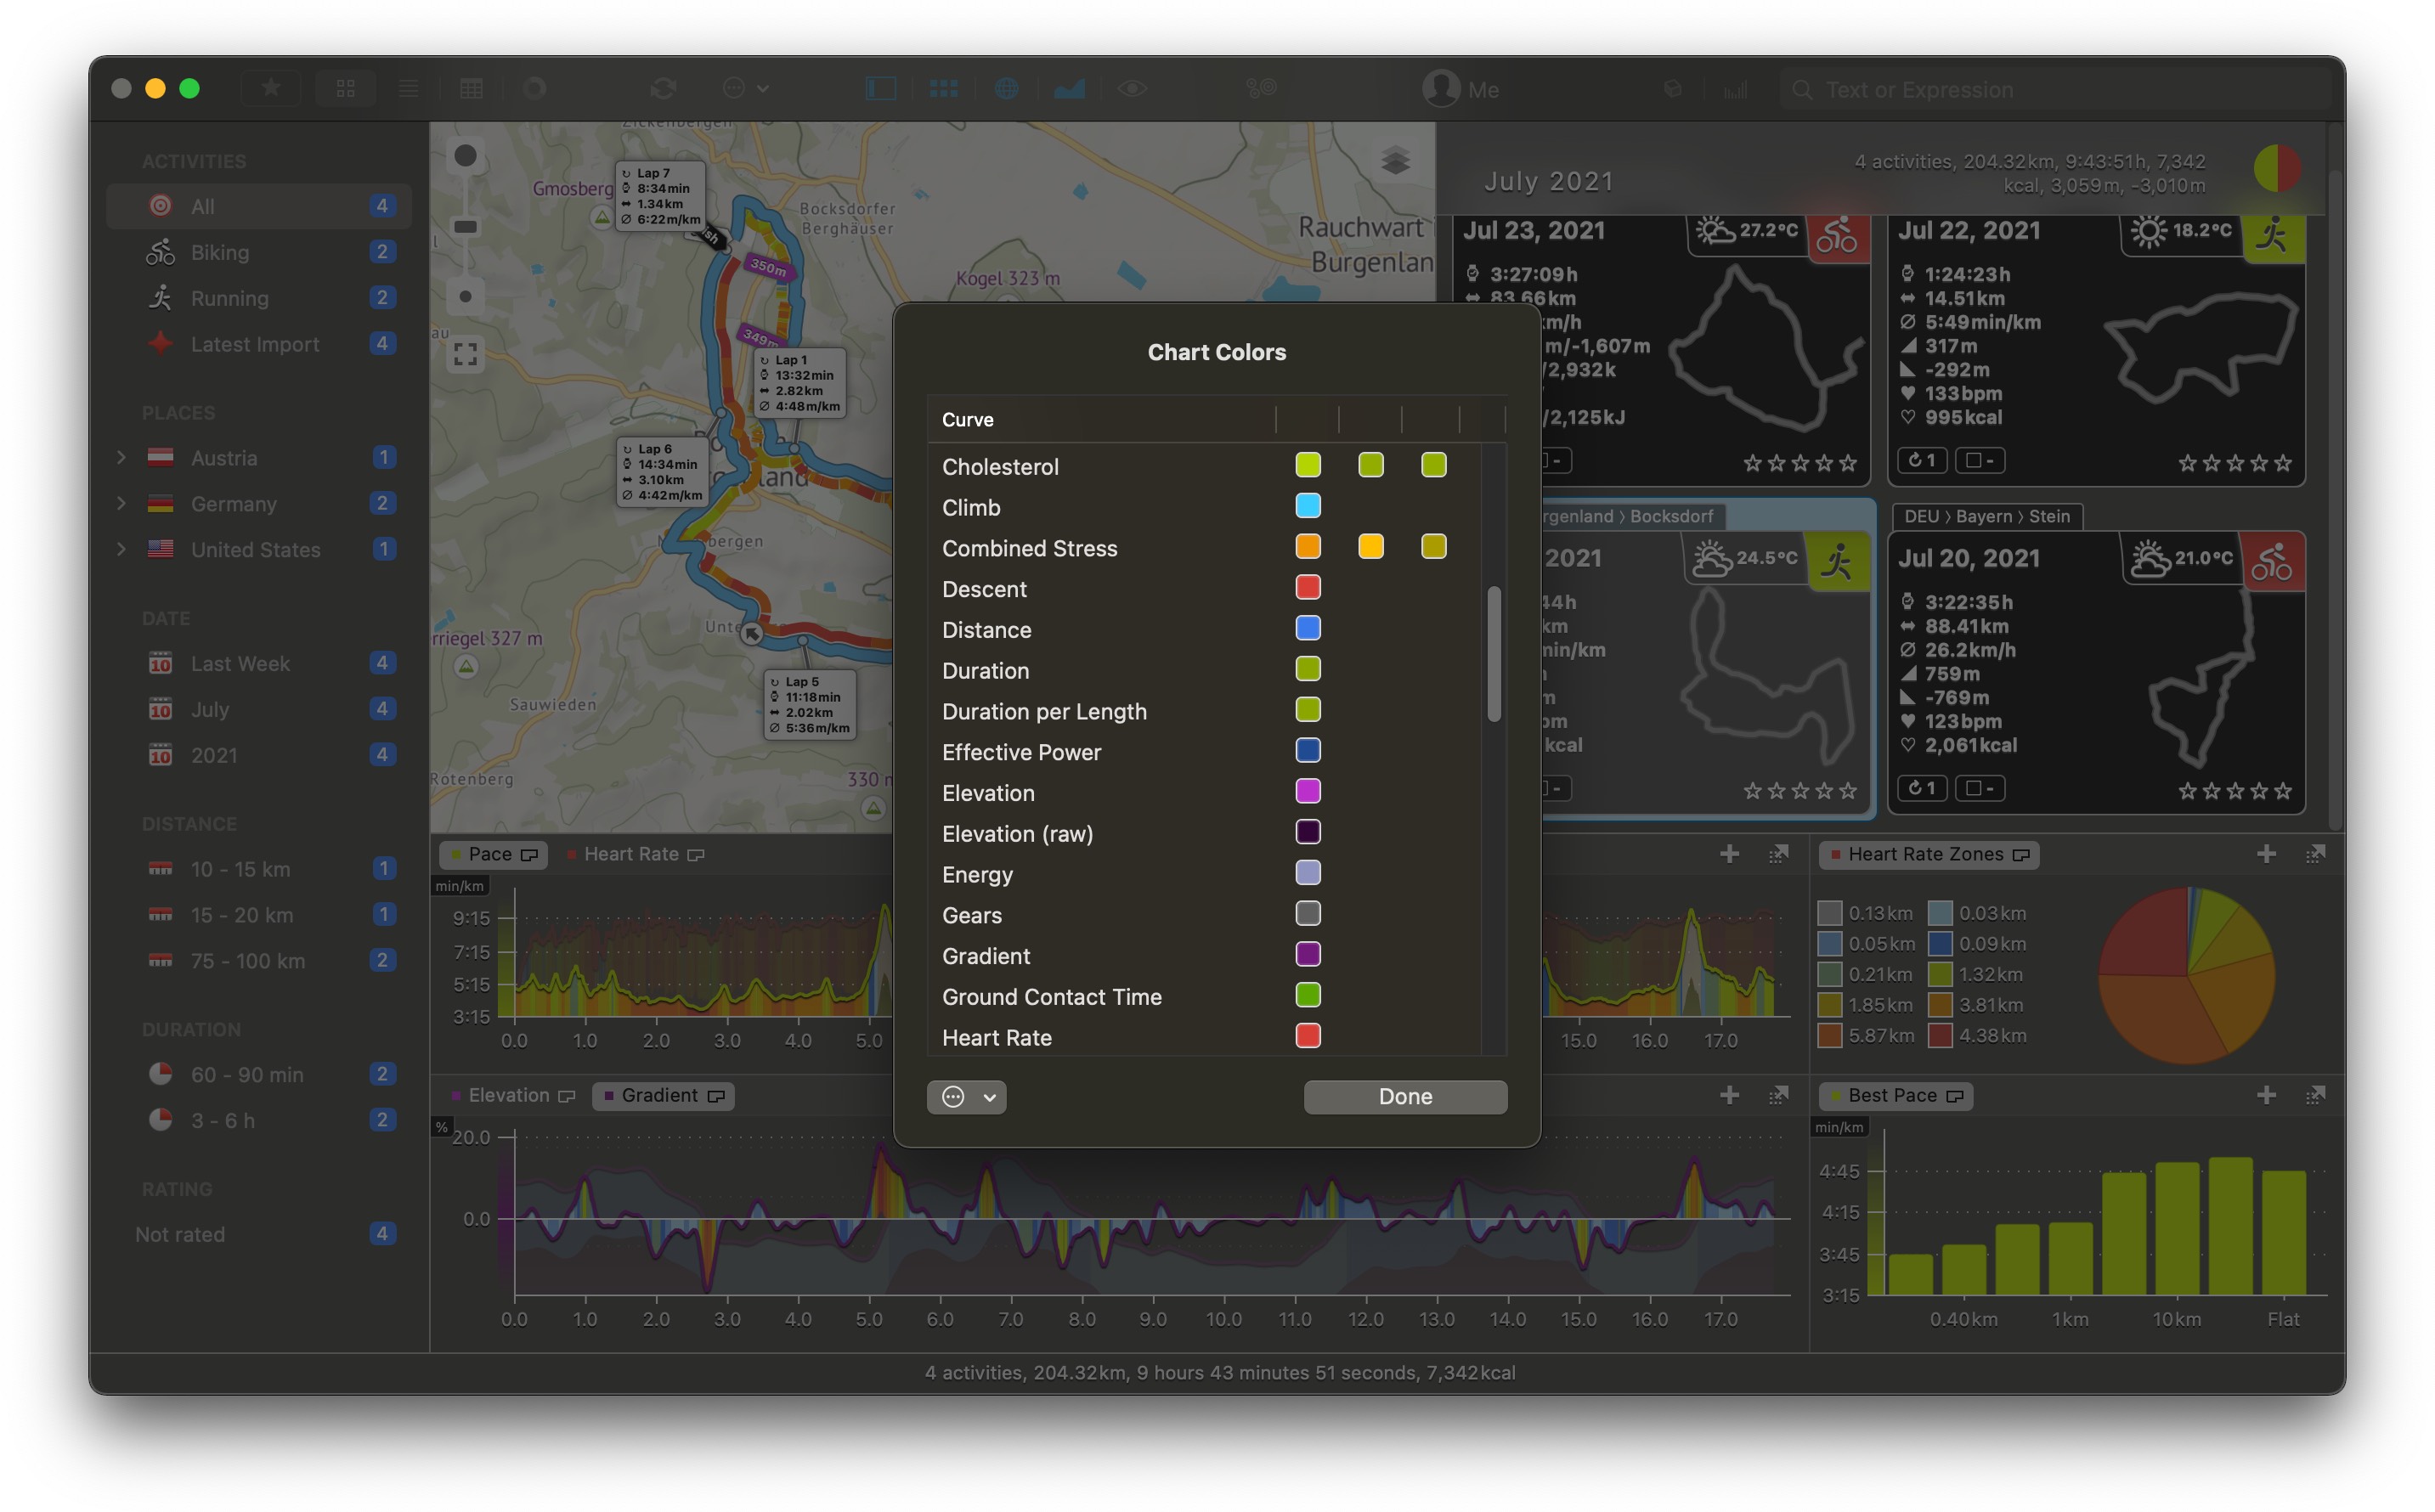
All curve colors can now be configured using the new Chart Colors tool.
- Accessible via "Customize > Chart Colors…" from the main menu.
- Colors can be changed for individual or multiple curves at once.
- Color settings can be saved and loaded to files, enabling sharing color-themes with other users.
- Color settings can be reset to factory defaults at any time.
- Colors are synced to rubiTrack on the iPhone.
Zones in bar chart curves now indicate the zone index by height of the colored area.
The unit display in chart curves is now more pronounced so it can be read more easily in busy charts.
Fixes problems in the summary chart when combining series with inconsistent timelines into one axis.
Improves positioning of the axis labels of the timeline.
The time-axis of athlete log curves now use the general setting for the time interval in the training summary.
New Athlete Log for iOS
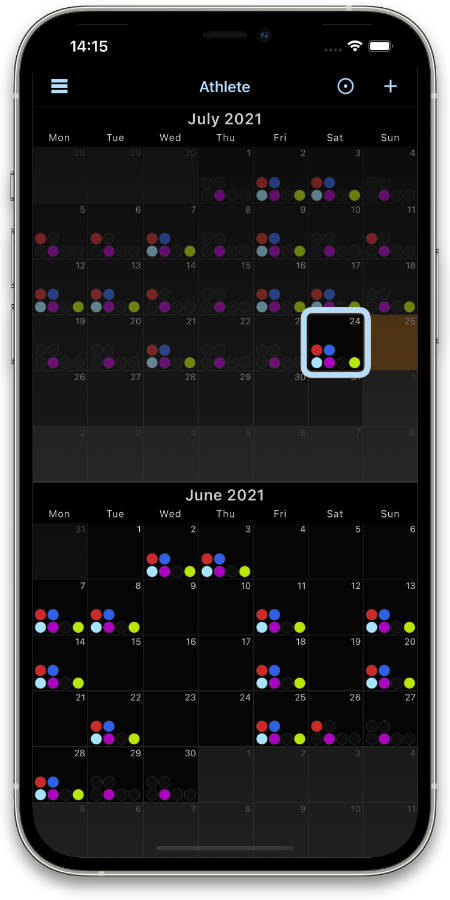
rubiTrack 6 for iPhone comes with a completely new athlete log front end.
- Log entries are displayed in a calendar.
- Each day with entries gets color-coded dots.
- While viewing log details, you can browse entries by swiping left or right or by using the arrow buttons.
Text size
Adds a new application preference "Text Size" (via "rubiTrack > Preferences >> General"), which allows for adjusting the text size of the main UI components.
- There are 4 setting levels: Small, Medium (default), Large or X-Large.
- The Small setting is equivalent to previous text size of older rubiTrack versions.
Available on the App Store
rubiTrack 6 is available from the App Store as a Universal App for Mac and iPhone.
Access to all PRO features requires an annual subscription.
A subscription applies to all supported platforms both macOS and iOS.
Free 7-day trial period for first-time subscriptions.
rubiTrack is an extremely powerful tool even without subscription. Click here for details.
Assorted
(new in 6.2) Adds the ability to search for activities that carry specific track data using the new "hasdata:[DATATYPE]" search expression. Possible values for [DATATYPE] are: date, gpsdistance, speed, temperature, elevation, power, heartrate, cadence, verticaloscillation, stancetime, leftrightbalance, gear, formpower, legspringstiffness, stridelength, verticalratio, respirationrate, leftpowerphase, rightpowerphase, leftplatformcenteroffset, rightplatformcenteroffset.
(new in 6.2) When using the "Group by Activity Type" option in the Training Summary, the order of activity types is now always the same, regardless of the timeline's starting point or which filters are selected.
rubiTrack now supports Apple Silicon natively.
New activity export "CSV Summary", which can be used to generate activity summary spreadsheets for sharing with a coach, physician or nutritionist, for example.
Better UI feedback when importing files.
Now shows pace of rowing activities as min/500m (or min/500yd depending on the unit setup).
Adds the "Row Distance" unit option in the application preferences ("rubiTrack > Preferences >> Units").
Publishing has been updated to use a better layout and rubiTrack maps.
WiFi syncing is now faster.
Adds a new decade date filter in the sidebar's "Date" group. When enabled (the default) years in past decades will be grouped under one root. This option can be controlled in the application preference "Sidebar" settings.
Dates and time of day in the activity list view and segments view are now displayed in the activity's timezone.
Adds new "Cloud backup" option in the rubiTrack "WiFi & Cloud" application preferences. Data downloaded from the cloud will be stored in the backup folder selected.
When upgrading old rubiTrack files the user now chooses a new file name/location before the upgrade takes place. The new file is written to the disk when the upgrade is complete.
rubiTrack 6 uses an updated file format with the .rubitrack6 file extension.
rubiTrack 6 for iPhone now correctly imports swimming activities including stroke type and stroke count per length.
Data from rt2go can be upgraded to rubiTrack 6 by copying the data file, see FAQ.
There have been many, many other smaller changes, improvements and bug fixes.


